")
Gravity Wave Interactions in the Global Atmosphere (GWING)
PIs:
Hauke Schmidt, Max Planck Institute for Meteorology (MPI-M), Hamburg (Coordinator)
Günther Zängl, Deutscher Wetterdienst (DWD), Offenbach
Elisa Manzini, MPI-M, Hamburg
Postdocs:
Andrea Schneidereit; Claudia Stephan (Phase 2, through May 2019); Guidi Zhou (Phase 1), MPI-M, Hamburg
Sebastian Borchert, DWD, Offenbach
Further contributions from:
Ulrich Achatz, Goethe University Frankfurt, Frankfurt/Main
Erich Becker, Leibniz Institute for Atmospheric Physics, Kühlungsborn
Michael Baldauf, DWD, Offenbach
Summary
Internal gravity waves (GWs) link different layers of the atmosphere from the troposphere to the thermosphere and drive the large-scale circulation of the middle atmosphere. However, many of the processes from their generation via propagation to dissipation are still incompletely understood and due to their small (often sub-grid) length scale they are poorly represented in numerical weather prediction and climate models. GWING is one of the projects of the research unit MS-GWaves that aims at advancing our understanding of the above mentioned multiscale dynamical processes involving atmospheric GWs with the ultimate goal to develop a unified parameterization of sub-grid scale GW processes (and their effects) from the sources to the dissipation. To contribute to this, the central goal of the project GWING is the development and application of the UA-ICON atmospheric general circulation model. With UA-ICON, the GWING project is integrating the new knowledge generated by the whole MS-GWaves unit. In the 2nd phase of GWING we will focus on the following overarching scientific questions:a) What is the relevance of GW features neglected in classical parameterizations, i.e. horizontal propagation, non-instantaneous propagation, and wave transience-mean flow interactions.b) What is the role of gravity waves for the global atmospheric circulation and its variability?To answer these questions, we will use UA-ICON globally at both GW-permitting resolution and coarse resolution but with a state-of-the-art WKB GW-parameterization (MS-GWaM). Furthermore, we will continue to simulate and analyse episodes with locally highly resolved, GW-resolving nests. The model simulations will be combined with the observational knowledge from the partner projects. The major UA-ICON development goals in phase 2 of GWING are therefore the implementation of MS-GWaM (developed in partner project 3DMSD), the implementation of physics-based sources (jointly with partner projects SV and 3DMSD), and the improved treatment of GWs at high model resolutions. Using the different configurations of UA-ICON will finally allow to assess the importance of so far neglected features, i.e. to answer our first overarching question. A specific objective for GWING is this assessment for the situation during SSWs which provide rapidly changing and zonally inhomogeneous propagation conditions for GWs, and therefore may be particularly prone to effects of non-instantaneous propagation and wave transience-mean flow interactions. With respect to the 2nd overarching question, the role of GWs for the global atmospheric circulation, besides SSWs, we will focus on a) the role of GWs and model extension to the upper atmosphere for circulation changes under global warming, and b) the role of GWs for weather forecasting skill.
Overview
In phase 1 of MS-GWaves, we extended the ICON general circulation model by an upper-atmosphere configuration. This configuration is named UA-ICON. Two central elements of an atmosphere model had to be modified for this purpose, the physics parameterizations and the dynamical core. We tried to illustrate this in Fig. 1. In global standard simulations of ICON, the top of the model atmosphere is typically placed at an altitude of about 80 km (in the upper mesosphere). With UA-ICON, we are able to raise the model top at a height of about 150 km (lower thermosphere). Climatological simulations with UA-ICON compare relatively well with observations (see Fig. 2). A detailed description of UA-ICON can be found in [1] (see end of page).
One focus of phase 2 is on the execution and analysis of ICON and UA-ICON simulations, in order to answer our questions regarding the interactions:
- gravity waves ⇔ global atmospheric circulation
- gravity waves ⇔ weather features (such as (thunder) storms, fronts, jets and polar vortices)
- resolved gravity waves ⇔ parameterized gravity waves ⇔ model atmosphere
For the analysis of the simulation results, we use tools that have been developed by our research group partners, for instance.
One question, on which we worked together with our partners form MS-GWaves/SV is: How does the parameterization of convection influence the resolved gravity-wave-borne vertical flux of horizontal momentum in the convective gray zone? By “convective gray zone”, we mean the horizontal grid resolution range between about 1 to 10 km. In this range model dynamics can already resolve a part of the convection explicitly. Many limited-area models for weather forecast operate already in this resolution range and global models will probably follow in the foreseeable future. We used two ICON simulations with a horizontal mesh size of 5 km for our investigation. In one simulation the parameterization of convection is switched on, in the other it is switched off. Among other interesting results, we found that the momentum flux in the subtropics of the northern hemisphere (between about 20°N and 40°N) in the simulated period of the month August is significantly larger in the simulation without the parameterization of convection than in the simulation with (see Fig. 3). We attribute this to a higher frequency of relatively strong convection events in the simulation without parameterization, since convection is one of the major gravity wave sources in these latitudes. You can find further details on our study in [2] (see end of page).

In a subsequent study, we investigated how the resolved gravity-wave-borne momentum flux depends on the model formulation and the horizontal grid resolution. Data of 6 simulations with 3 different models went into this analysis: the Japanese Non-hydrostatic Icosahedral Atmospheric Model (NICAM) with horizontal grid mesh sizes of 3.5 km and 7 km, respectively, the Integrated Forecast System (IFS) of the European Centre for Medium-Range Weather Forecasts (ECMWF) with mesh sizes of 4 km and 9 km, and finally ICON with mesh sizes of 2.5 km and 5 km. The simulated period is the August 2016. These 6 simulations are part of the DYAMOND initiative (see https://www.esiwace.eu/services/dyamond). In general, we observed a relatively good agreement of the gravity wave signals in the used observational data on the one hand and in the data from all simulations on the other hand. Nevertheless, we can observe systematic differences between the different models in the subtropics of the northern hemisphere, for instance (see Fig. 4). Since convection is one of the major sources of gravity waves in these latitudes, we assume that differences in the frequency and strength of convection events between the models cause the observed discrepancies. Another finding is that we could not observe a systematic dependence of the momentum flux on the horizontal grid resolution within the investigated resolution range. Further results of this study can be found in [3] (see end of page).

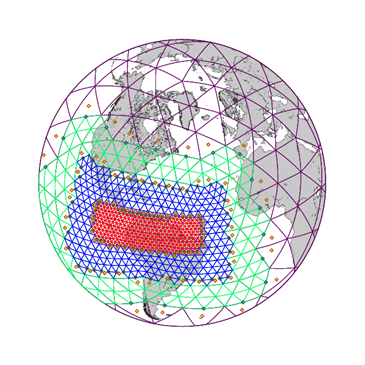
In collaboration with our partners from MS-GWaves/PACOG, we are currently comparing observations from measurement campaigns with data from UA-ICON simulations of corresponding episodes. The observations consists, e.g., of vertical temperature profiles derived from LIDAR measurements, which have a relatively high spatial and temporal resolution. In order to resolve a large fraction of the gravity wave spectrum in our simulations, we use horizontal grid nesting, from a global grid mesh size of 20 km down to 1.25 km in the finest nest (see Fig. 5). After assessing how well the simulation data agree with the observations, we plan to reconstruct the history of the observed gravity waves from the time series of the 3D fields from the simulations, for instance.

The implementation of new features for (UA-)ICON, which proved to be very desirable during phase 1 of GWING, are another focus of phase 2. An example is global nudging, which allows us to perform continuous episodic simulations of several days in which the state of the model atmosphere diverges significantly less from the observation as compared to simulations without nudging (see Fig. 6).

Last but not least the parameterization of unresolved gravity waves in general circulation models is a key subject in phase 2 of GWING (see Fig. 7). The two conventional ansatzes in ICON parameterize orographic gravity waves (forced by sub-grid scale orography) and non-orographic gravity waves (forced by resolved or unresolved weather features, such as fronts, convection and jets). Our question is, if we can improve the numerical weather prediction by a modification of the control parameters or a modification of the formulation of the parameterizations itself. In this context, we would like to highlight the gravity wave ray tracing model MS-GWaM newly developed by our partners in MS-GWaves/3DMSD. It allows to model the interaction between unresolved gravity waves and the resolved state of the model atmosphere considerably more realistically than the conventional ansatzes, and includes processes that are not covered at all by the conventional ansatzes. MS-GWaM has been implemented into ICON by our project partners in 3DMSD and yields already partly better results in the middle and upper atmosphere than the conventional parameterizations.

If you would like to learn more about ICON:
- Earth system modelling with ICON at the Max Planck Institute for Meteorology in Hamburg:
https://mpimet.mpg.de/en/communication/news/focus-on-overview/icon-earth-system-model/
- Numerical weather prediction with ICON at the German Weather Service (DWD):
https://www.dwd.de/EN/research/weatherforecasting/num_modelling/01_num_weather_prediction_modells/icon_description.html?nn=484268
- ICON homepage (information on the model documentation, the ICON license, training events etc.):
https://code.mpimet.mpg.de/projects/iconpublic
Publications
[4] C. C. Stephan, H. Schmidt, C. Zülicke and V. Matthias. Oblique gravity wave propagation during sudden stratospheric warmings. J. Geophys. Res.-Atmos., 125, https://doi.org/10.1029/2019JD031528 2020.
[3] C. C. Stephan, C. Strube, D. Klocke, M. Ern, L. Hoffmann, P. Preusse and H. Schmidt. Intercomparison of gravity waves in global convection-permitting models. J. Atmos. Sci., 76, 2739-2759, https://doi.org/10.1175/JAS-D-19-0040.1, 2019.
[2] C. C. Stephan, C. Strube, D. Klocke, M. Ern, L. Hoffmann, P. Preusse and H. Schmidt. Gravity waves in global high-resolution simulations with explicit and parameterized convection. J. Geophys. Res.-Atmos., 124, 4446-4459, doi:10.1029/2018JD030073, 2019.
[1] S. Borchert, G. Zhou, M. Baldauf, H. Schmidt, G. Zängl and D. Reinert. The upper-atmosphere extension of the ICON general circulation model (version: ua-icon-1.0). Geosci. Model Dev., 12, 3541-3569, https://doi.org/10.5194/gmd-12-3541-2019, 2019.