")
Spontaneous Imbalance (SI) - Results
Here we give some insight into current research with some selected pubications:
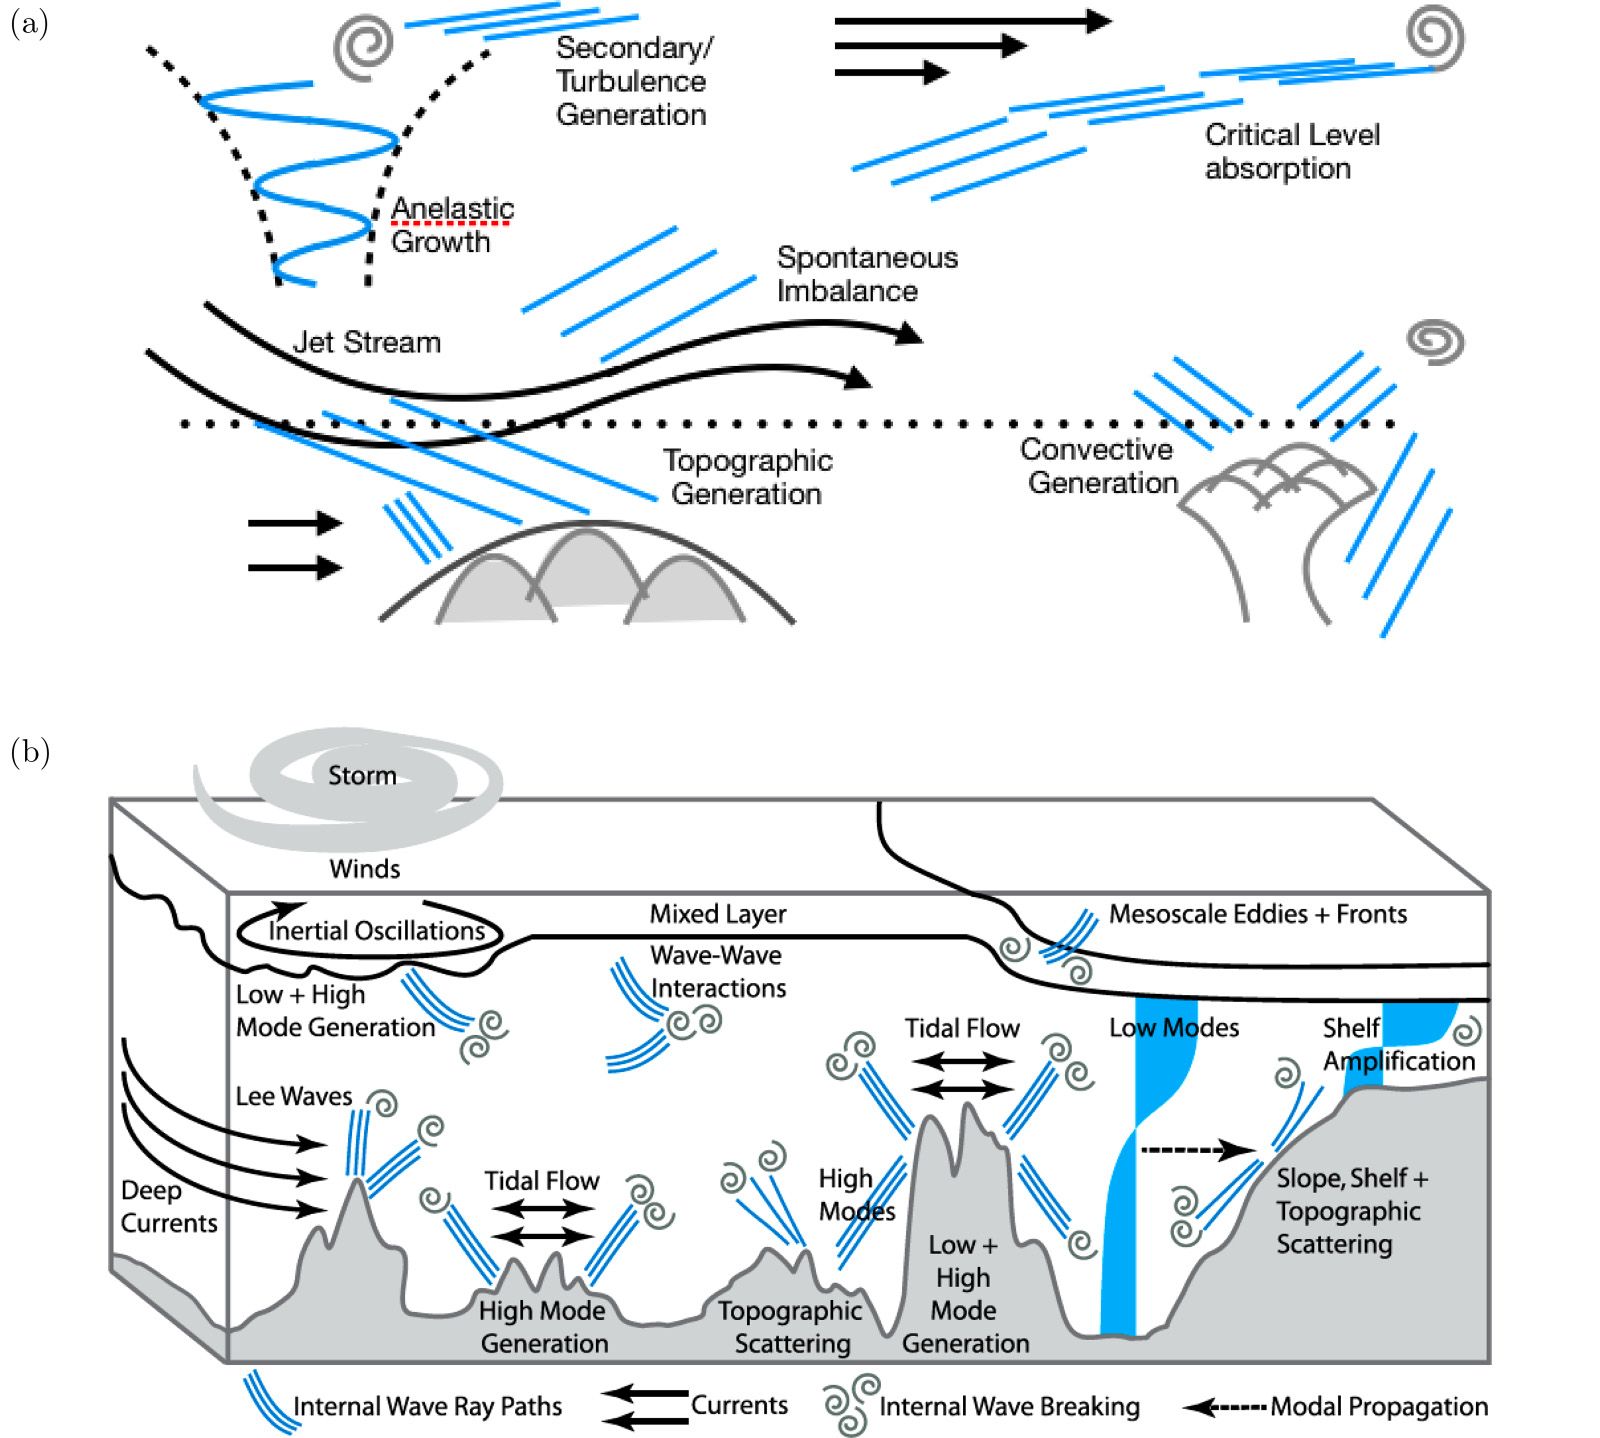
Recent progress in modeling imbalance in the atmosphere and ocean.
by Sutherland, B. R., U. Achatz, C.-c. P. Caulfield & J. M. Klymak, 2019: Phys. Rev. Fluids 4: 010501, doi:10.1103/PhysRevFluids.4.010501.
Imbalance refers to the departure from the large‐scale primarily vortical flows in the atmosphere and ocean whose motion is governed by a balance of Coriolis, pressure gradient, and buoyancy forces and can be described approximately by quasigeostrophic theory or similar balance models. Imbalanced motions are manifest either as fully nonlinear turbulence or as internal gravity waves which can extract energy from these geophysical flows but which can also feed energy back into the flows. The outcome of a workshop held in February 2018 workshop at the Banff International Research Station (BIRS) is reported upon here.
Spontaneous inertia–gravity wave emission in the differentially heated rotating annulus experiment.
by Hien, S., J. Rolland, S. Borchert, L. Schoon, C. Zülicke & U. Achatz, 2018: J. Fluid Mech. 838: 5-41, doi:10.1017/jfm.2017.883.
The source mechanism of inertia–gravity waves (IGWs) observed in numerical simulations of the differentially heated rotating annulus experiment is investigated. The focus is on the wave generation from the balanced part of the flow, a process presumably contributing significantly to the atmospheric IGW field. Direct numerical simulations are performed for an atmosphere-like configuration of the annulus. The by the balanced part of the flow is found to play a significant role in the generation of IGWs, so it supplements boundary-layer instabilities as a key factor in the IGW emission in the differentially heated rotating annulus.

A new atmospheric-like differentially heated rotating annulus configuration to study gravity wave emission from jets and fronts.
by Rodda, C., S. Hien, U. Achatz & U. Harlander, 2020: Exp. Fluids 61: 2, doi:10.1007/s00348-019-2825-z.
Significant inertia-gravity wave activity has been frequently observed in the vicinity of jet and front systems in the atmosphere. Although many studies have established the importance of these non-orographic sources, the mechanisms responsible for spontaneous wave emissions are still not fully understood. For this reason, we offer a newly built laboratory experiment supported by numerical simulations that allow N∕f > 1 . The conditions for gravity wave emission in this new configuration are examined in detail, and the first evidence of IGWs is reported.

The spatio–temporal variability of nonorographic gravity wave energy and relation to its source functions.
by Amiramjadi, M., A. R. Mohebalhojeh, M. Mirzaei, C. Zülicke & R. Plougonven, 2020: Mon. Wea. Rev.: in press, doi:10.1175/MWR-D-20-0195.1.
How well can nonorographic gravity waves be predicted? To answer this question we used an expression for the wave energy expected to be generated from jets, fronts and convection and verified over six ocanic regions in four years ERA5 data with the diagnosed wave energy. The scatter plot indicates a correlation of 0.79 although the predictions were a factor three soo small.

For more information, see the complete list of Publications
Further information at the Spontaneous Imbalance Homepage (SI) (restricted access)